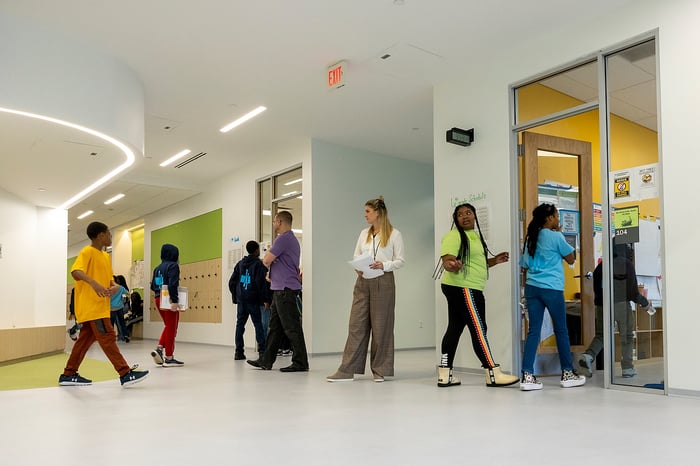
Two elementary schools in the same district get their fall reading data back. At both schools, the average RIT score for 4th-grade students with disabilities is 155. Meanwhile, the average RIT score for non-disabled fourth graders was 180.
The district responds the way many districts do. It buys a new reading intervention program for both schools and adds 30 minutes of intervention to every student's day.
By spring, growth at one school has picked up. At the other, it's worse.
We see this pattern underneath some of the data partners come to us with. The same number can come from two opposite problems, and a fix chosen from the number alone can help one school and hurt the next. The data that districts rely on most, the average for "students with disabilities," is often the least useful number for figuring out which problem you have.
Key takeaway: One average for students with disabilities can hide the students who are furthest behind. Before you pick a fix, look at the story underneath. What’s happening with groups of students at the margins, across grade levels, and over time? Are these subgroup trends, all-student trends, or opportunity gaps widening? Are outcomes emerging from certain teachers or certain subjects? Two schools can post the same average scores and need opposite fixes.
Two schools, one number
Here's what was happening behind the average. (Both schools are composites drawn from our partner work.)
Birch Elementary: students weren't getting targeted skill instruction
At Birch, students with disabilities participated in the general education literacy block, but the instructional model did not consistently provide the explicit, targeted instruction some students needed. Without protected planning time or a clear structure for specially designed instruction, students were exposed to grade-level content without receiving sufficient support to address foundational skill gaps.
The new intervention block gave them that time. Growth picked up.
Maple Elementary: students were missing grade-level instruction
At Maple, the opposite was true. Students with disabilities were already receiving targeted interventions, but those services often came at the expense of core literacy instruction. Jordan, a fourth grader with a reading disability, left his classroom every morning just as his classmates began engaging with grade-level texts. While he practiced foundational reading skills in a small group down the hall, he missed opportunities to engage with the same content and discussions as his peers.
Targeted instruction outside the general education classroom can be an important part of meeting students' individualized needs. The problem at Maple wasn't the intervention itself, but how it was scheduled. Students were receiving additional support while losing access to essential grade-level instruction.
The extra 30 minutes came out of more core time. Jordan's gap with his classmates widened. As did the general gap between students with disabilities in the school and their non-disabled peers.

Why disaggregate data for students with disabilities?
If a data report averages together scores for students whose needs and experiences have little in common, educators may be tempted to adopt blanket strategies that ignore the range of needs and experiences of the students they serve.
Averages tend to miss students on the margins in at least three ways:
- They blend different students. Strong growth for students with milder needs can cover flat growth for students with more intensive ones.
- Proficiency rates ignore real progress. A student who moves from three grade levels behind to two is still "not proficient" on the state test. Two years of strong teaching can look like no change at all. Schools and districts may give up on strategies producing meaningful growth.
- District averages hide which school is which. Maple and Birch would blend into one flat district number, and the district would risk giving both groups the same response despite vastly different root causes.
There's a legal reason this matters too. In Endrew F. v. Douglas County School District (2017), the Supreme Court held that a student's program must be "reasonably calculated to enable a child to make progress appropriate in light of the child's circumstances." That standard is about each student as an individual. A subgroup average can't tell you whether you're meeting it.
Growth vs. proficiency: which should leaders watch for students with disabilities?
Proficiency tells you whether a student met the grade-level bar on one test. Growth tells you how far that student moved from where they started. For students with disabilities, especially those furthest behind, proficiency can stay flat for years while real learning happens, and growth can reveal a stall that proficiency never flags. Leaders need both, read side by side for each student, not only for the subgroup.
| Proficiency | Growth | |
|---|---|---|
| What it measures | Whether a student met the grade-level standard on one test | How far a student moved from their own starting point |
| What it shows well | Whether students are reaching grade-level expectations | Whether instruction is working for each student, at every starting point |
| What it misses | Progress for students far below the bar. A student who closes a full grade level can still show up in a report as "not proficient." | Whether students are on track to reach grade level, if growth goals are set too low |
| Question it answers | Are students performing below, above, or at grade level? | Is this student's program working, and is the goal ambitious enough to produce meaningful progress? |
Why does the same data point to different problems?
An average tells you what happened, and rarely why. Flat growth at Birch came from missing skill instruction. Flat growth at Maple came from missing grade-level instruction. To tell them apart, you have to look at where students actually spend their day, what they're taught there, and how each student's growth compares with where they started.
Doing that takes time, and we should not pretend otherwise. Leaders under pressure want to act on the data quickly. But spending the time to examine the data costs far less than a year of a fix that widens the gap for the most at-risk students.

How do we improve outcomes for students with disabilities?
Start by examining proficiency rates alongside growth for each student with a disability. Break the students with disabilities data apart by school, grade level, starting point, and disability type; check where students spend core instruction; and match the investment to what you find. Find out what is holding growth back in each school, then put resources behind the fix for that cause. Winter benchmark data lands in the next few weeks, right as next year's budget and professional learning plans take shape, so now is the window to look beyond averages.
- Break the subgroup apart. Look at growth by starting point, by disability category, by grade level, and by school. The pattern that matters is not easily seen by simply examining averages.
- Look at growth alongside proficiency. Students far from grade level need to be judged on how far they moved compared to their starting point.
- Check where students are during core instruction. If intervention, related services, or pull-out sessions are scheduled during grade-level literacy or math, students may be trading core instruction for support.
- Seek to understand. Create some hypotheses about what’s causing the trends and what might address those specific areas. Pressure test your assumptions for bias and unintended consequences.
- Match the fix to the cause. Once each school's root cause is clear, the investment can go straight at it.
Try this at your next team meeting (15 minutes)
Select five students with disabilities who represent different patterns in your academic data, including students demonstrating strong growth, limited growth, and persistent gaps in proficiency.
- What does the relationship between growth and proficiency tell us about their progress?
- What additional information do we need to understand their instructional experience?
- Are students receiving both meaningful access to grade-level instruction and the individualized support they need?
- What instructional or systems-level conditions might explain the patterns we're seeing?
Use these questions to identify hypotheses worth investigating before making changes to instruction or allocating additional resources.
How ABC helps districts see underneath the average
ABC's Comprehensive Needs Assessment is built for exactly this question. Using the THRIVE Framework, we look across instruction, teaming, leadership routines, and family partnership, and we read student data, classroom observations, schedules, surveys, and interviews side by side. Each school comes away knowing what is producing its numbers, and the district gets an Inclusive Schools Blueprint that puts the next round of spending where it will count. Across ABC partners in SY 2024 to 2025, we saw a 71% increase in inclusive instructional practices and a 41% gain in IEP quality scores.
Book a short needs assessment call today
|
Once you know the cause, THRIVE Academy gives your whole staff self-paced training aimed at it, with unlimited seats across your school or network. Not ready for a full assessment? Start with the free THRIVE Self-Assessment. It takes 10 to 15 minutes and gives your leadership team a shared starting read across the five THRIVE elements. |
FAQs about data for students with disabilities
Why isn't the "students with disabilities" average enough?
It combines students with very different needs into one number, which is why schools need to disaggregate it. Gains for some students can cover flat growth for others, and the students furthest behind are the easiest to miss. Breaking the data apart by starting point, disability, and school shows where growth is actually happening.
What is root cause analysis in special education?
Root cause analysis traces a result, like flat reading growth, back to the conditions in a school that produce it: schedules, who plans with whom, and what instruction students can access. A needs assessment applies that method across a school or district and names the priorities to act on first.
When should a district do a needs assessment?
Ideally before budgets and professional learning plans are set for the next school year. In many districts that means starting in late fall or winter, so findings are ready when spending decisions get made.
Which needs assessments support multi-school improvement planning?
Look for one that uncovers district-wide trends and coherence across a single school and all schools. ABC's Comprehensive Needs Assessment gets beneath overall averages, looking at districtwide data, schedules, observations, and interviews against the THRIVE Framework. Triangulating multiple sources of data helps uncover root causes to provide a deeper story around what’s happening at multiple levels.
Maple and Birch reported the same outcomes, but the conditions contributing to those outcomes were fundamentally different. Understanding those differences is essential to determining what needs to change.
Looking at whether students with disabilities are growing overall is helpful. In order to get to a more focused solution, it's important to go beyond that to examine whether instructional practices, systems, and resource decisions are creating the conditions for every student to make meaningful progress.
Sources: Endrew F. v. Douglas County School District RE-1, 580 U.S. 386 (2017); Alliance for Excellent Education, "Ensuring Every Student Matters: N-Size" fact sheet (2018).